Category

Data Science

Data Science – Cutting through the Buzz

By Data Science

There is No denying that now the most and spoken about term in today’s technical world is data science. One “google search” and it returns millions of learning platforms, bootcamps, job post, graphs, pictures, blogs and companies offering various services on data science and what not. Here, my humble try is to cut through those mega-technical words and all the “fluff” and try to explain the terminology and “demystify” the process. My hope is this will help you to build and understanding around it and help you to make informed decision in case you are looking for a career choice, include it in your professional roadmap or try to incorporate it in your organization.

Wikipedia describe it as

Data science is an interdisciplinary field that uses scientific methods, processes, algorithms and systems to extract knowledge and insights from noisy, structured and unstructured data, and apply knowledge and actionable insights from data across a broad range of application domains.”

I have highlighted and hyperlinked certain words because those are the key to understand Data Science. Data Science is not a single operation, in a large organization a “Data Science Process” is often done by an entire team, each individual specialized in their domain, chipping in.

Data Science Process Flow -Deconstructed (The Purpose)

A Typical Data science problem or process can be further divided into this following section.

  1. Frame the problem: This is where an individual or an organization defines what problem they are trying to address or what is their goal to achieve. Here is a list of common uses of a typical data science project.
  • Identify and Refine “Target/goal” aka Data Driven Quantifiable Decision making
  • Fraud Detection
  • Recommendation system
  • Help to follow “best Practice” and issues that “matters”
  • Risk assessment and Mitigate planning

And the list goes on.

2:Collect Data: This is where a data scientist collect data from users or accessing a database. Data Architect and Data Engineers are often consulted in this step to make sure the data is accessible and meets all its requirements to be used in a project.  This part of Data collection and next one Data Cleaning is the most time consuming and vital step of the process

3: Process the Data: here a Data scientist (with the help of other Data “fairies”) help to clean, concise, condition and preprocess the data. Data Collection and Cleaning most of the time comprises of 60-65% of a data Science project time (figure 1)

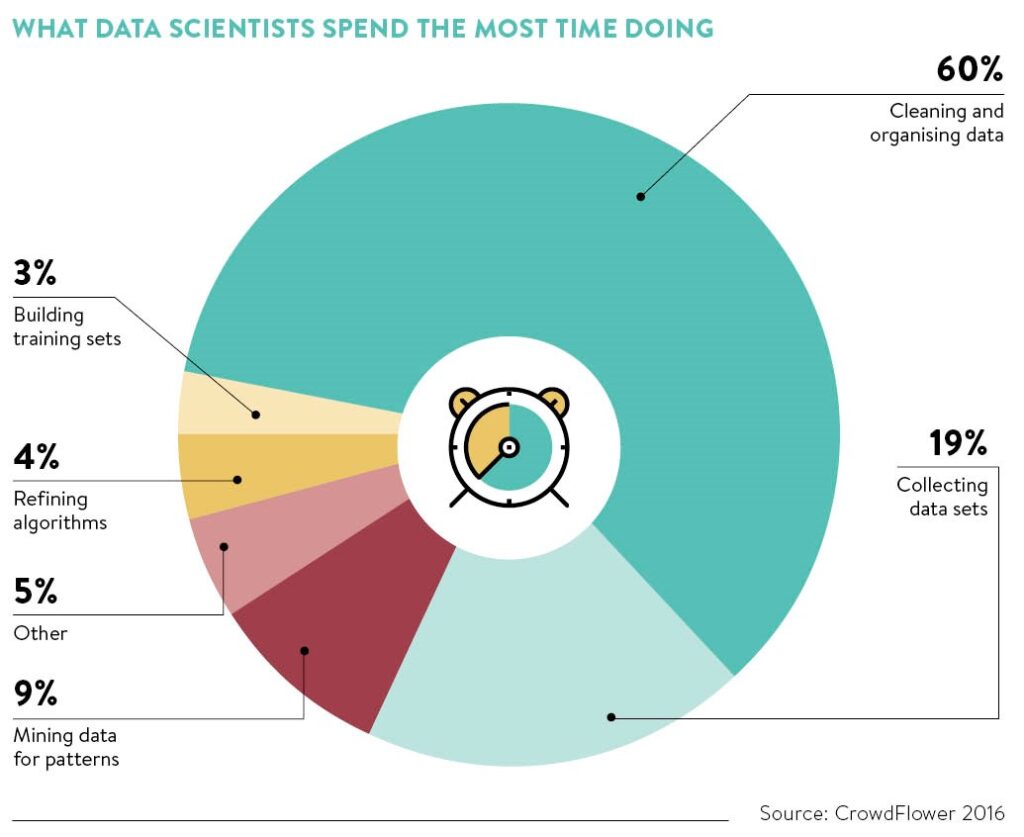
Figure 1: Generic Data Science process flow and breakdown of times(CrowdFlower 2016)

4: Explore the Data: here data is looked at in depth for patterns, hidden trends etc. Multiple plots, visuals, operations are used in this step.

5: Model Building/ In depth Analysis: Here the data scientist work with the data to figure out the most suited and optimal model to use. They do hypothesis testing, split data into test and training set, select and tune features, tune hyperparameters, run automatic model selection-test-validation etc. They use analytics, Machine learning (supervised and unsupervised), Artificial Intelligence (AI) and Natural Language Processing (NLP) depending on the problem they are trying to solve.

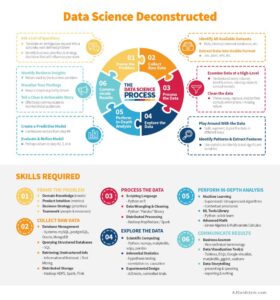
Figure 2: Data Science deconstructed

6: Communicate result: In this step they communicate the results with the end user and see if this solution is good enough. Often there is a round or “iteration” happens in this part of process and once the model is final, it gets deployed and monitored for further tuning.

Tools and Technology (The weapon)

You will never find a data scientist who doesn’t like a picture over words, they are indeed very graphic people. So, I will start this section with this borrowed image explaining the most used and needed tools in the process. This list is ever-growing and by no means suggestive. This is a good checklist of reference for aspirant data scientist or a person scouting for Data Science service providers.

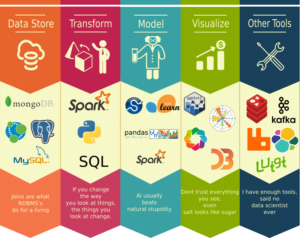
Figure 3: tools of Data Science (courtesy bigdata. Black)

The interconnected discipline serving data (The Gang)

As I mentioned before there are other discipline names and people, we hear often associated with data science (such as ML engineers, Computer Scientist, Data Engineers etc) and we are sometimes unsure where they fit in a data science project.  In this portion I designed a chalkboard graphics to explain how these separate fields are interconnected and where they add value. Data Science, Machine Leaning, Data Engineer/Architect work close to each other and in often overlap in their contribution in a project. The three Bubble shows three field and where they overlap in terms of the science and the flowchart is more from a project.

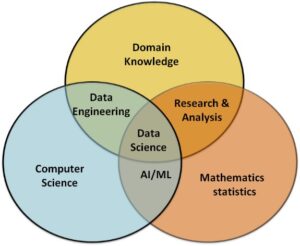
               Figure 4: The interrelated field of Data Science


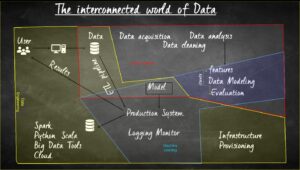
Figure 5: Interconnected world of Data

BLACK HOLES: Getting Data from The Void of Space and Time

By Data Science

Staring into space looking for black holes, with data science when can see them.

“What can black holes teach us about the boundaries of knowledge? These holes in spacetime are the darkest objects and the brightest—the simplest and the most complex. With unprecedented access, Black Hole | The Edge of All We Know follows two powerhouse collaborations.”

Trailer: https://youtu.be/5yOExnfxJ8Q

The film explores multiple facets of the enigma. It takes a fascinating look at the mystery from various perspectives and disciplines. It shows the struggles and challenges of measuring and capturing usable material from incomprehensibly far distances. On one end, an international collaboration, the Event Horizon Telescope (EHT), brings teams from across the globe to create the first image of a black hole together. On the other, a collaboration with the late Stephen Hawking delves into mathematics and physics to formulate a reproducible theory that black holes do output some form of quantifiable information in lieu of the paradox it represents. This is all woven on the common thread in pursuit of scientific knowledge and philosophical observation of what can be understood and known.

What draws the attention here, especially with the EHT project, is the creative way the vast amount of data needed was captured from across the planet. The stored data is then aggregated, analyzed by the numerous teams on the project, and strictly siloed in their own space to come up with resulting visualizations to be compared with the rest of the collaboration. The outcome is monumental and satisfyingly celebratory; the first ever picture of a black hole.

The resulting image was released on 10 April 2019 and seen in the following forty-eight hours by several billion people: the most-viewed scientific image in history.


On a recent article on Live Science, Maximiliano Isi, an astrophysicist at the Massachusetts Institute of Technology, expresses this sentiment, “I’m obsessed with these objects because of how paradoxical they are. They’re extremely mysterious and confounding, yet at the same time we know them to be the simplest objects that exist.” Despite the lack of direct data, conclusive findings can still be modeled based on gathered available information surrounding a black hole, even if it is a void where everything seemingly disappears in its mere presence.

The film shows that this can be done due having good data to analyze. This could not have been possible if the information gathered is not clean, and the project itself would have unraveled at any given point during the process. The results from the various teams in the collaboration would have been vastly different and the outcome would have lacked consensus.

Hawking’s group, on the other hand, in their search to counter the paradox presented, found that formulating a consistent result was more challenging than initially thought as the mathematics proposed required more than just their collective knowledge and years of experience in the field of physics. Had the efforts continued, it would not only have taken an immense amount of time but would have also increased the likelihood of human error in the manual process. In the end, they managed to successfully formulate a viable solution with the help of additional computing power and dependable data.

The importance of having good, clean information cannot be underestimated, regardless of the field. This is the reason why data cleaning, and the numerous relationships from which it can be applied, is so crucial and valuable. Data is the stuff of dreams. How we interpret and make use of its potential is what makes them real.


References:

The Edge of All We Know (blackholefilm.com)

First Image of a Black Hole | NASA Solar System Exploration

Famous Stephen Hawking theory about black holes confirmed (msn.com)

Graph Data Science

By Data Science

By Muqaddas Mehmood

Graph Data Science and Analytics

Graph Data Science is an alternative of analytics that uses an abstraction called a graph model. The accessibility of this model allows rapid consolidation and connection of large volumes of data from many sources in ways that refine the limitations of its source structures (or lack thereof). Graph analytics is an alternative to the traditional data warehouse model as a framework for absorbing both structured and unstructured data from various sources to enable analysts to probe the data in an undirected manner.

Big data analytic systems should enable a platform that can support different analytic techniques that can be adapted in ways to help solve a variety of challenging problems. This suggests that these systems are high performance, elastic distributed data environments that enable the use of creative algorithms to utilize variant modes of data management in ways that differ from the traditional batch-oriented approach to data warehousing.


The Simplicity of Graph Science

Graph analytics is based on a model of representing individual entities and the numerous kinds of relationships that connect those entities. More precisely, it employs the graph abstraction for representing connectivity, consisting of a collection of vertices (which are also referred to as nodes or points) that represent the modeled entities, connected by edges (which are also referred to as links, connections, or relationships) that capture the way the two entities are related.

The flexibility of the model is based on its simplicity. A simple unlabeled undirected graph, in which the edges between vertices neither reflect the nature of the relationship nor indicate their direction, has limited utility.

Among other enhancements, these can enrich the meaning of the nodes and edges represented in the graph model:

· Vertices can be labeled to indicate the types of entities that are related.

· Edges can be labeled with the nature of the relationship.

· Edges can be directed to indicate the “flow” of the relationship.

· Weights can be added to the relationships represented by the edges.

· Additional properties can be attributed to both edges and vertices.

· Multiple edges can reflect multiple relationships between pairs of vertices.


Choosing Graph Analytics

Deciding the appropriate analytics application to a graph an analytics solution instead of the other big data alternatives can be based on the following characteristics and factors of business problems:

· Connectivity: The solution to the business problem requires the analysis of relationships and connectivity between a variety of different types of entities.

· Undirected discovery: Solving the business problem involves iterative undirected analysis to seek out as-of-yet unidentified patterns.

· Absence of structure: Multiple datasets to be subjected to the analysis are provided without any inherent imposed structure.

· Flexible semantics: The business problem exhibits dependence on contextual semantics that can be attributed to the connections and corresponding relationships.

· Extensibility: Because additional data can add to the knowledge embedded within the graph, there is a need for the ability to quickly add in new data sources or streaming data as needed for further interactive analysis.

· Knowledge embedded in the network: Solving the business problem involves the ability to employ critical features of the embedded relationships that can be inferred from the provided data.

· Ad hoc nature of the analysis: There is a need to run ad hoc queries to follow lines of reasoning.

· Predictable interactive performance: The ad hoc nature of the analysis creates a need for high performance because discovery in big data is a collaborative man/machine undertaking, and predictability is critical when the results are used for operational decision making.